Tableau for Salesforce

Tableau is a visual analytics and business intelligence tool. It brings raw, complex data to life through charts, visual reports and interactive dashboards. It helps organisations see, understand and make informed decisions based on their data.

Tableau was founded in 2003 by researchers at Stanford University who wanted to make the process of exploring databases and complex data sets more appealing and accessible. In 2019, Salesforce acquired the software and integrated it into the Salesforce ecosystem to connect this powerful visualisation solution to all of its CRM and sales data.

With Salesforce’s Customer 360 at the heart of marketing, sales, commerce, service and IT, users can access all data about their customers in one unified place. Tableau gives you the ability to get customer insights from this data more easily, so you can make informed and strategic decisions about your business based on what’s really happening with customers, partners and employees.

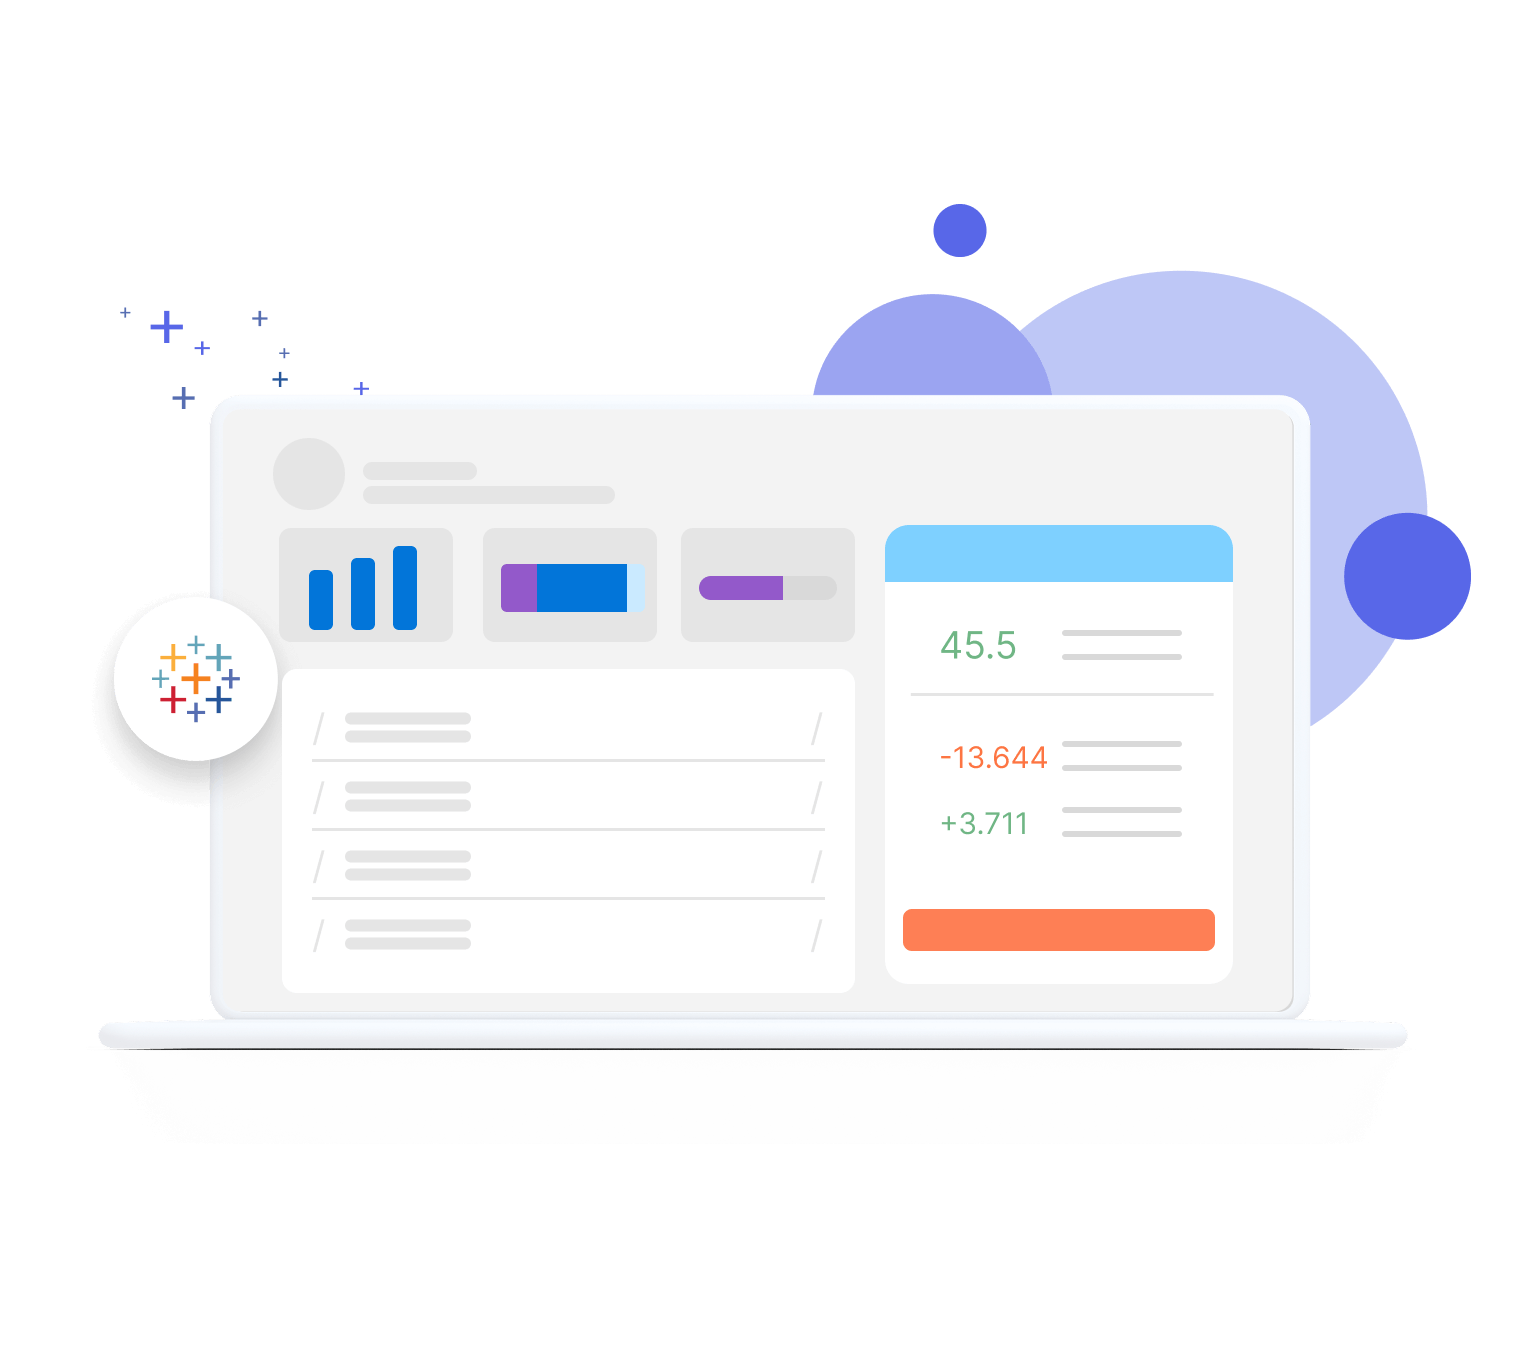
Tableau Key Features

Interactive Dashboards

With the easy drag and drop user experience, you can build interactive, multi-source dashboards, complex charts and maps or even just simple bar graphs.

Bring together data from multiple sources and platforms into one unified and connected dashboard view. This allows users to get a full picture of what’s going on in their business, without having to explore multiple data sets and struggle with insights from siloed sources.

Use dashboards to, at a glance, visually see how well a part of the business is doing. Tableau automatically adds context and meaning to every dashboard so you can discover and understand the data shown. With a comprehensive view of all business data, organisations can make informed decisions. Common uses for dashboards include sales, marketing, web performance and financials.

AI Insights

Traditionally, business intelligence tools require specialists to review and interpret the data and its trends; however, AI integrations within Tableau make it easy for anyone to understand the data and take action. Users can interact with the insights through natural language processing, contextual guidance and automation.


about Image

AI-powered analytics helps you:

  • Detect patterns and anomalies
  • Spot real-time insights
  • Predict outcomes with more accuracy
  • Recommend tailored next steps
  • Explore data and the visualisations with agents and natural language processing

Advanced Data Visualisations

To help make the data within reports and dashboards easier to understand, Tableau offers powerful data visualisation tools. These are a graphical representation of your organisation’s data, bringing together visual elements such as maps, charts or graphs. This helps you see and understand data trends, patterns and outliers in a clear, engaging visual way.

Clean your data

An important part of data visualisation is making sure the data you are working with is clean and shaped. Cleaning up your data makes it easier to combine with other data sources, analyse and even for others to understand when you share it.

Tableau offers various built-in cleaning solutions that help you achieve this. For example, removing fields, fixing values, combining records, and filtering.

Data visualisation and analytics are only ever as good as the data that you input, so ensuring that it’s been cleaned up is essential.

About Image

Integrating Tableau with Salesforce

There is a full Salesforce Tableau integration, enabling you to pull data in from Sales, Service, Marketing and Data Cloud. This enables you to bring in everything from pipeline and case volumes to campaign performance and unified customer profiles, and visualise it all in one place.

Once that Salesforce Tableau integration is in place, you can:

  • View Salesforce data in Tableau: See information in clear charts, graphs and dashboards that are easy to explore and drill into
  • Combine Salesforce with other systems: Blend Salesforce data with finance, ERP and other tools to get a complete picture of performance
  • Show insights inside Salesforce: Embed Tableau dashboards directly on Salesforce pages so users don’t have to switch between systems to understand what’s going on
  • Give the right people the right view: Provide role-based dashboards for sales leaders, service teams, marketers, finance and executives, each focused on what matters most to them

By using Salesforce as your source of truth, combined with Tableau as your visual insight layer, your teams get the insights and clarity they need to act quickly and confidently.


about Image

Tableau Consultants: How Simpala Can Help

At Simpala, we make sure Tableau and Salesforce don’t just connect, but actually work for your business.

As Tableau consultants, we can help you by:

  • Setting it up effectively: We securely connect Tableau to Salesforce and other systems, select the right data sources and reports, and configure refresh schedules so everything stays accurate and up to date
  • Designing useful dashboards We build clear, role-based dashboards for sales, service, marketing, finance and leadership, focused on the metrics that matter
  • Embedding insights into Salesforce: We surface Tableau dashboards directly inside Salesforce so teams can see what’s happening and take action in one place
  • Enabling your teams: We provide handover, training and ongoing support so your people feel confident exploring and evolving the dashboards over time

The result is a joined-up analytics setup that gives your teams clarity, not complexity.

About Image

Fancy a chat?